Tableau Dashboard Mockups

Tableau Dashboard Mockups


The mockups provided on this page use realistic, but scrambled data
Made for M2 technology and project consulting, with Adobe Illustrator
Throughout the course of my carreer, I had many exciting opportunities to develop Tableau dashboards for business intelligence clients from different industries. My role centers around understanding the unique requirements of each client when it comes to reporting and visualizing their data effectively. By closely collaborating with clients, I gain valuable insights into their specific needs and objectives.
Armed with this knowledge, I set out to design dashboard mockups that precisely align with the reporting needs of each client. My focus extends beyond mere data presentation; I place equal emphasis on optimizing usability and creating a seamless user experience. A user-centric approach is paramount to ensure that the dashboards I develop are intuitive, easy to navigate, and empower users to extract valuable insights effortlessly.
By melding data expertise with an eye for design, I craft dashboard solutions that showcase data in the most meaningful and impactful manner. It is immensely rewarding to witness how well-received these dashboards are. My career is a fantastic opportunity to contribute to the success of various businesses through the power of Tableau, and I continue to be passionate about transforming data into actionable insights.
Throughout my professional journey, I have also gained extensive experience in working with SQL databases, data preparation, and data analysis. As an integral part of my role in various projects, I utilize SQL to query, extract, and manipulate data from relational databases. The ability to write SQL queries allows me to access the required data, ensuring it is in the optimal format for analysis.
Data preparation is a crucial aspect of my work, involving the process of cleaning, transforming, and structuring raw data into a usable form. By employing various data preparation tools and techniques, such as data wrangling and Tableau Prep, I address data quality issues, handle missing values, and ensure consistency, setting the stage for accurate and insightful analyses.
In the realm of data analysis, I explore datasets, uncovering hidden patterns, trends, and valuable insights. I derive actionable conclusions from complex datasets, providing stakeholders with a comprehensive understanding of the underlying data-driven narratives.
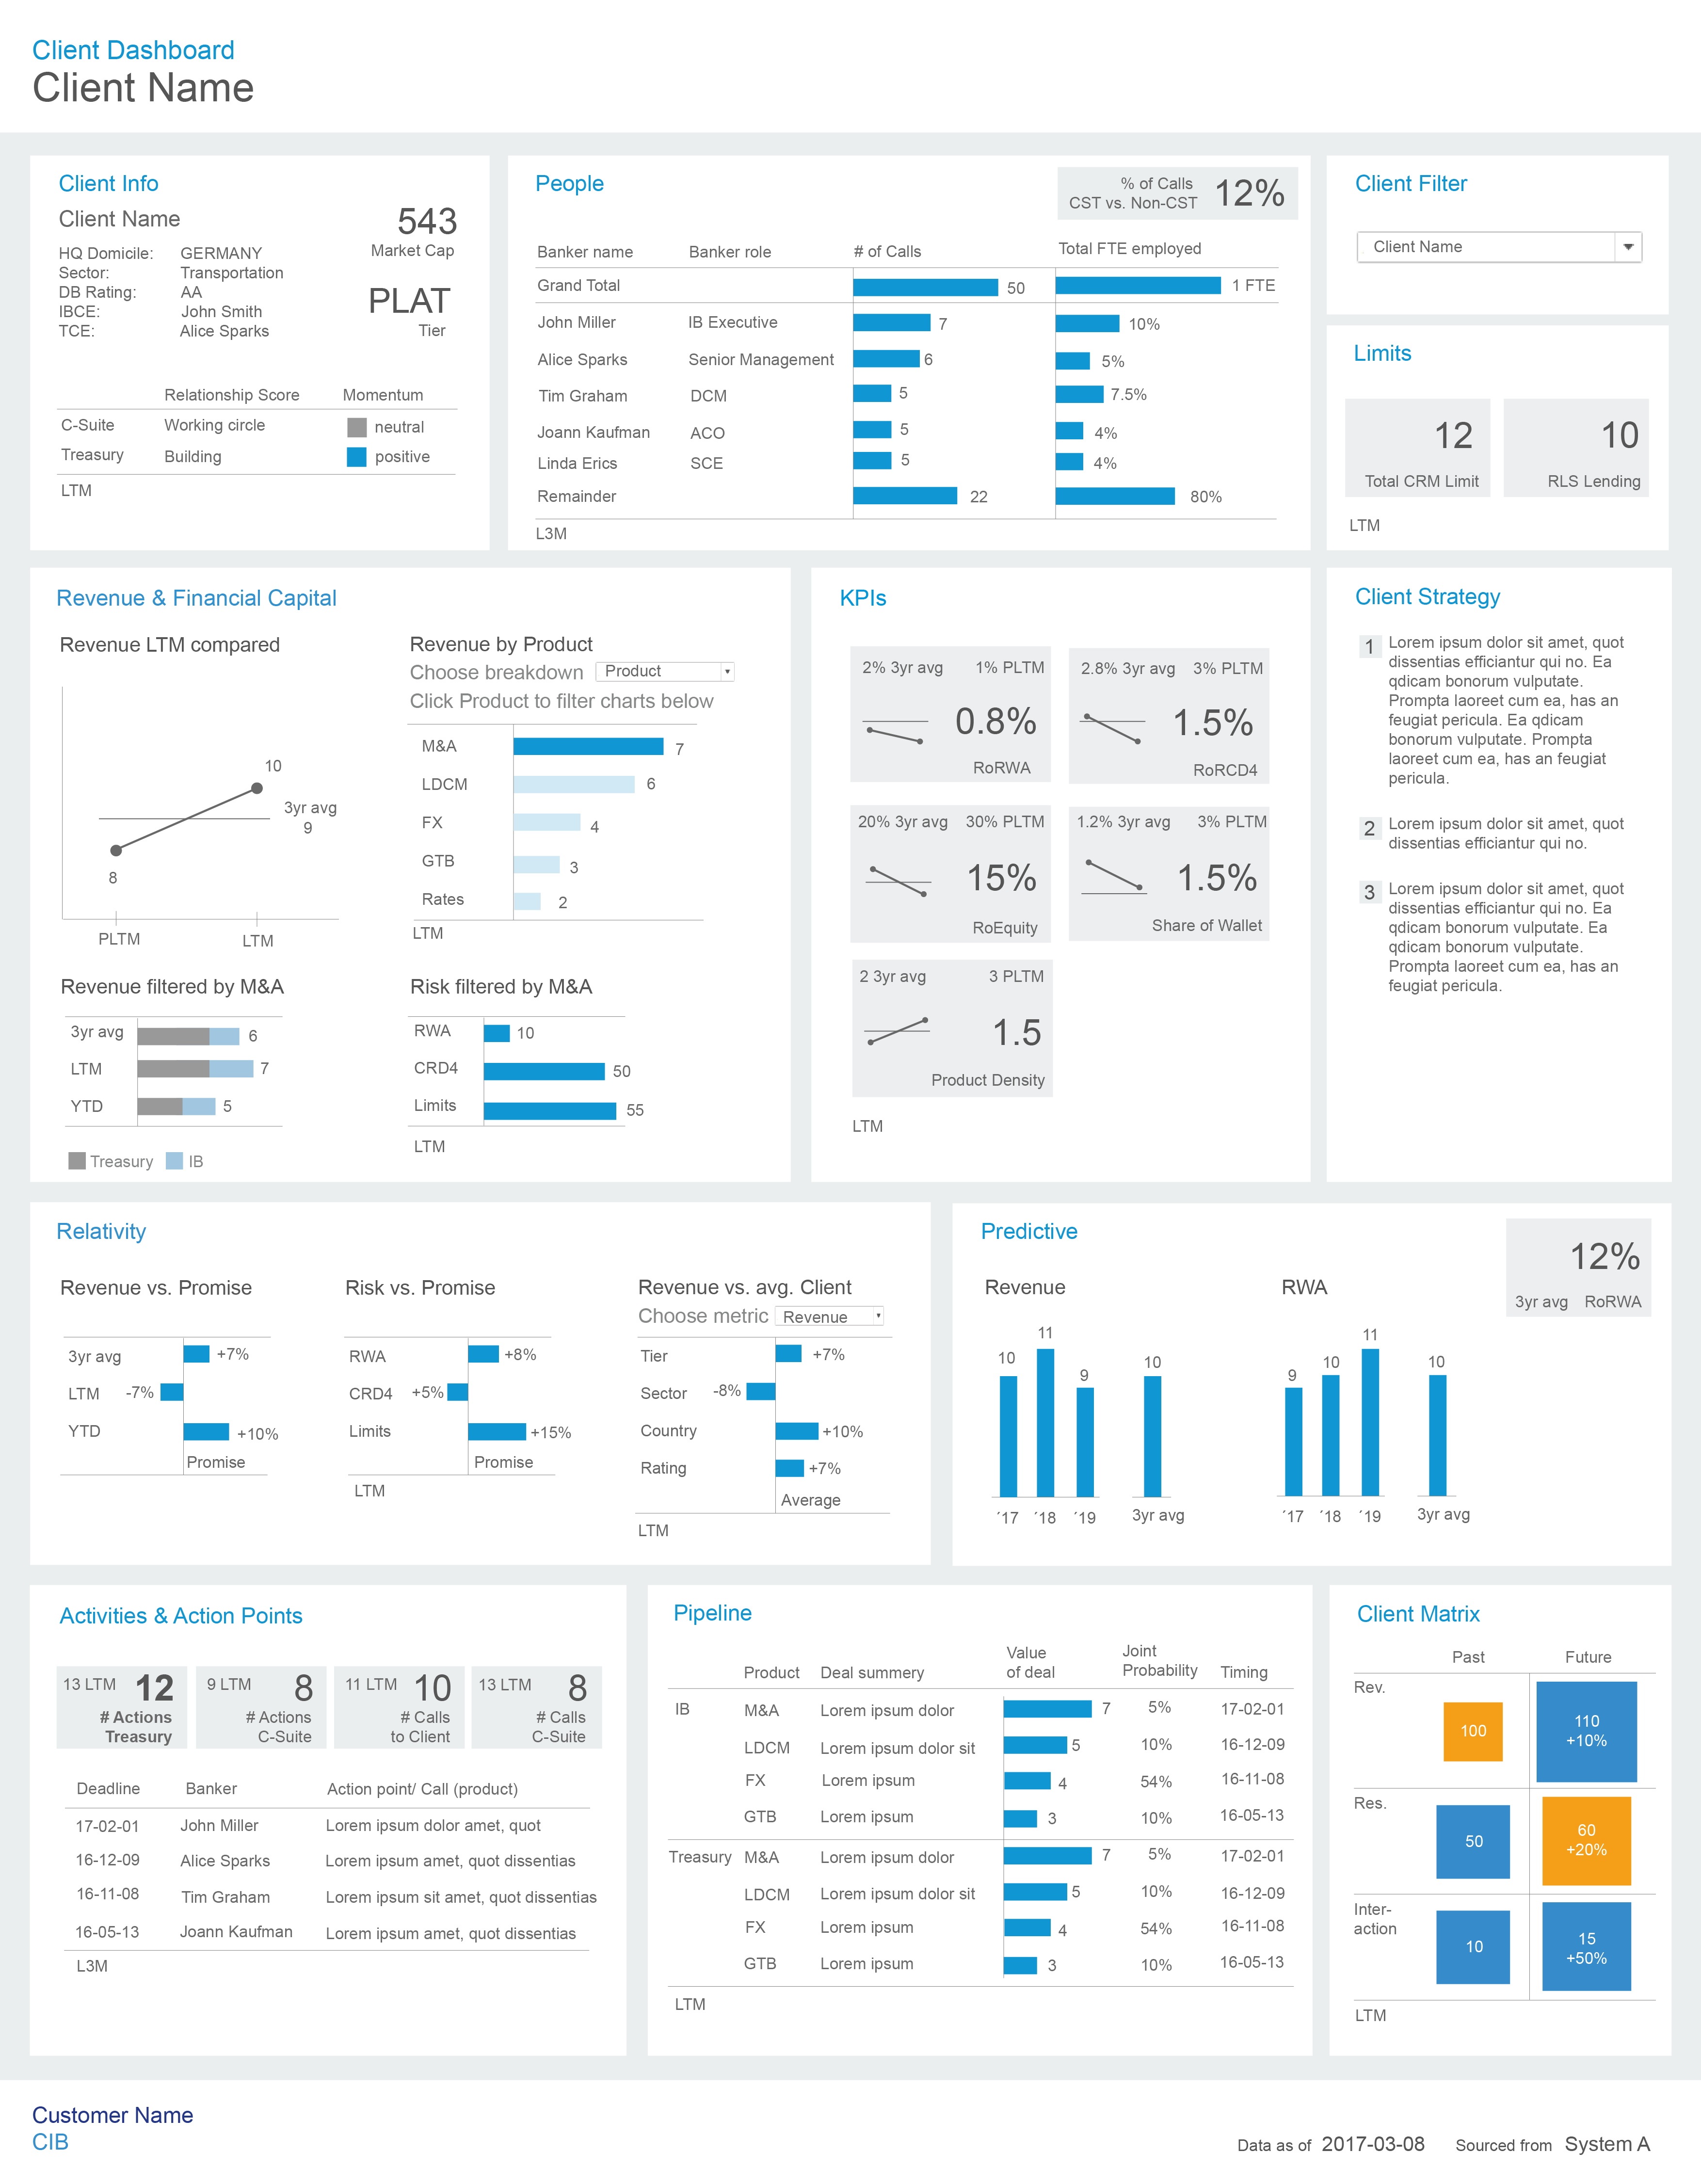
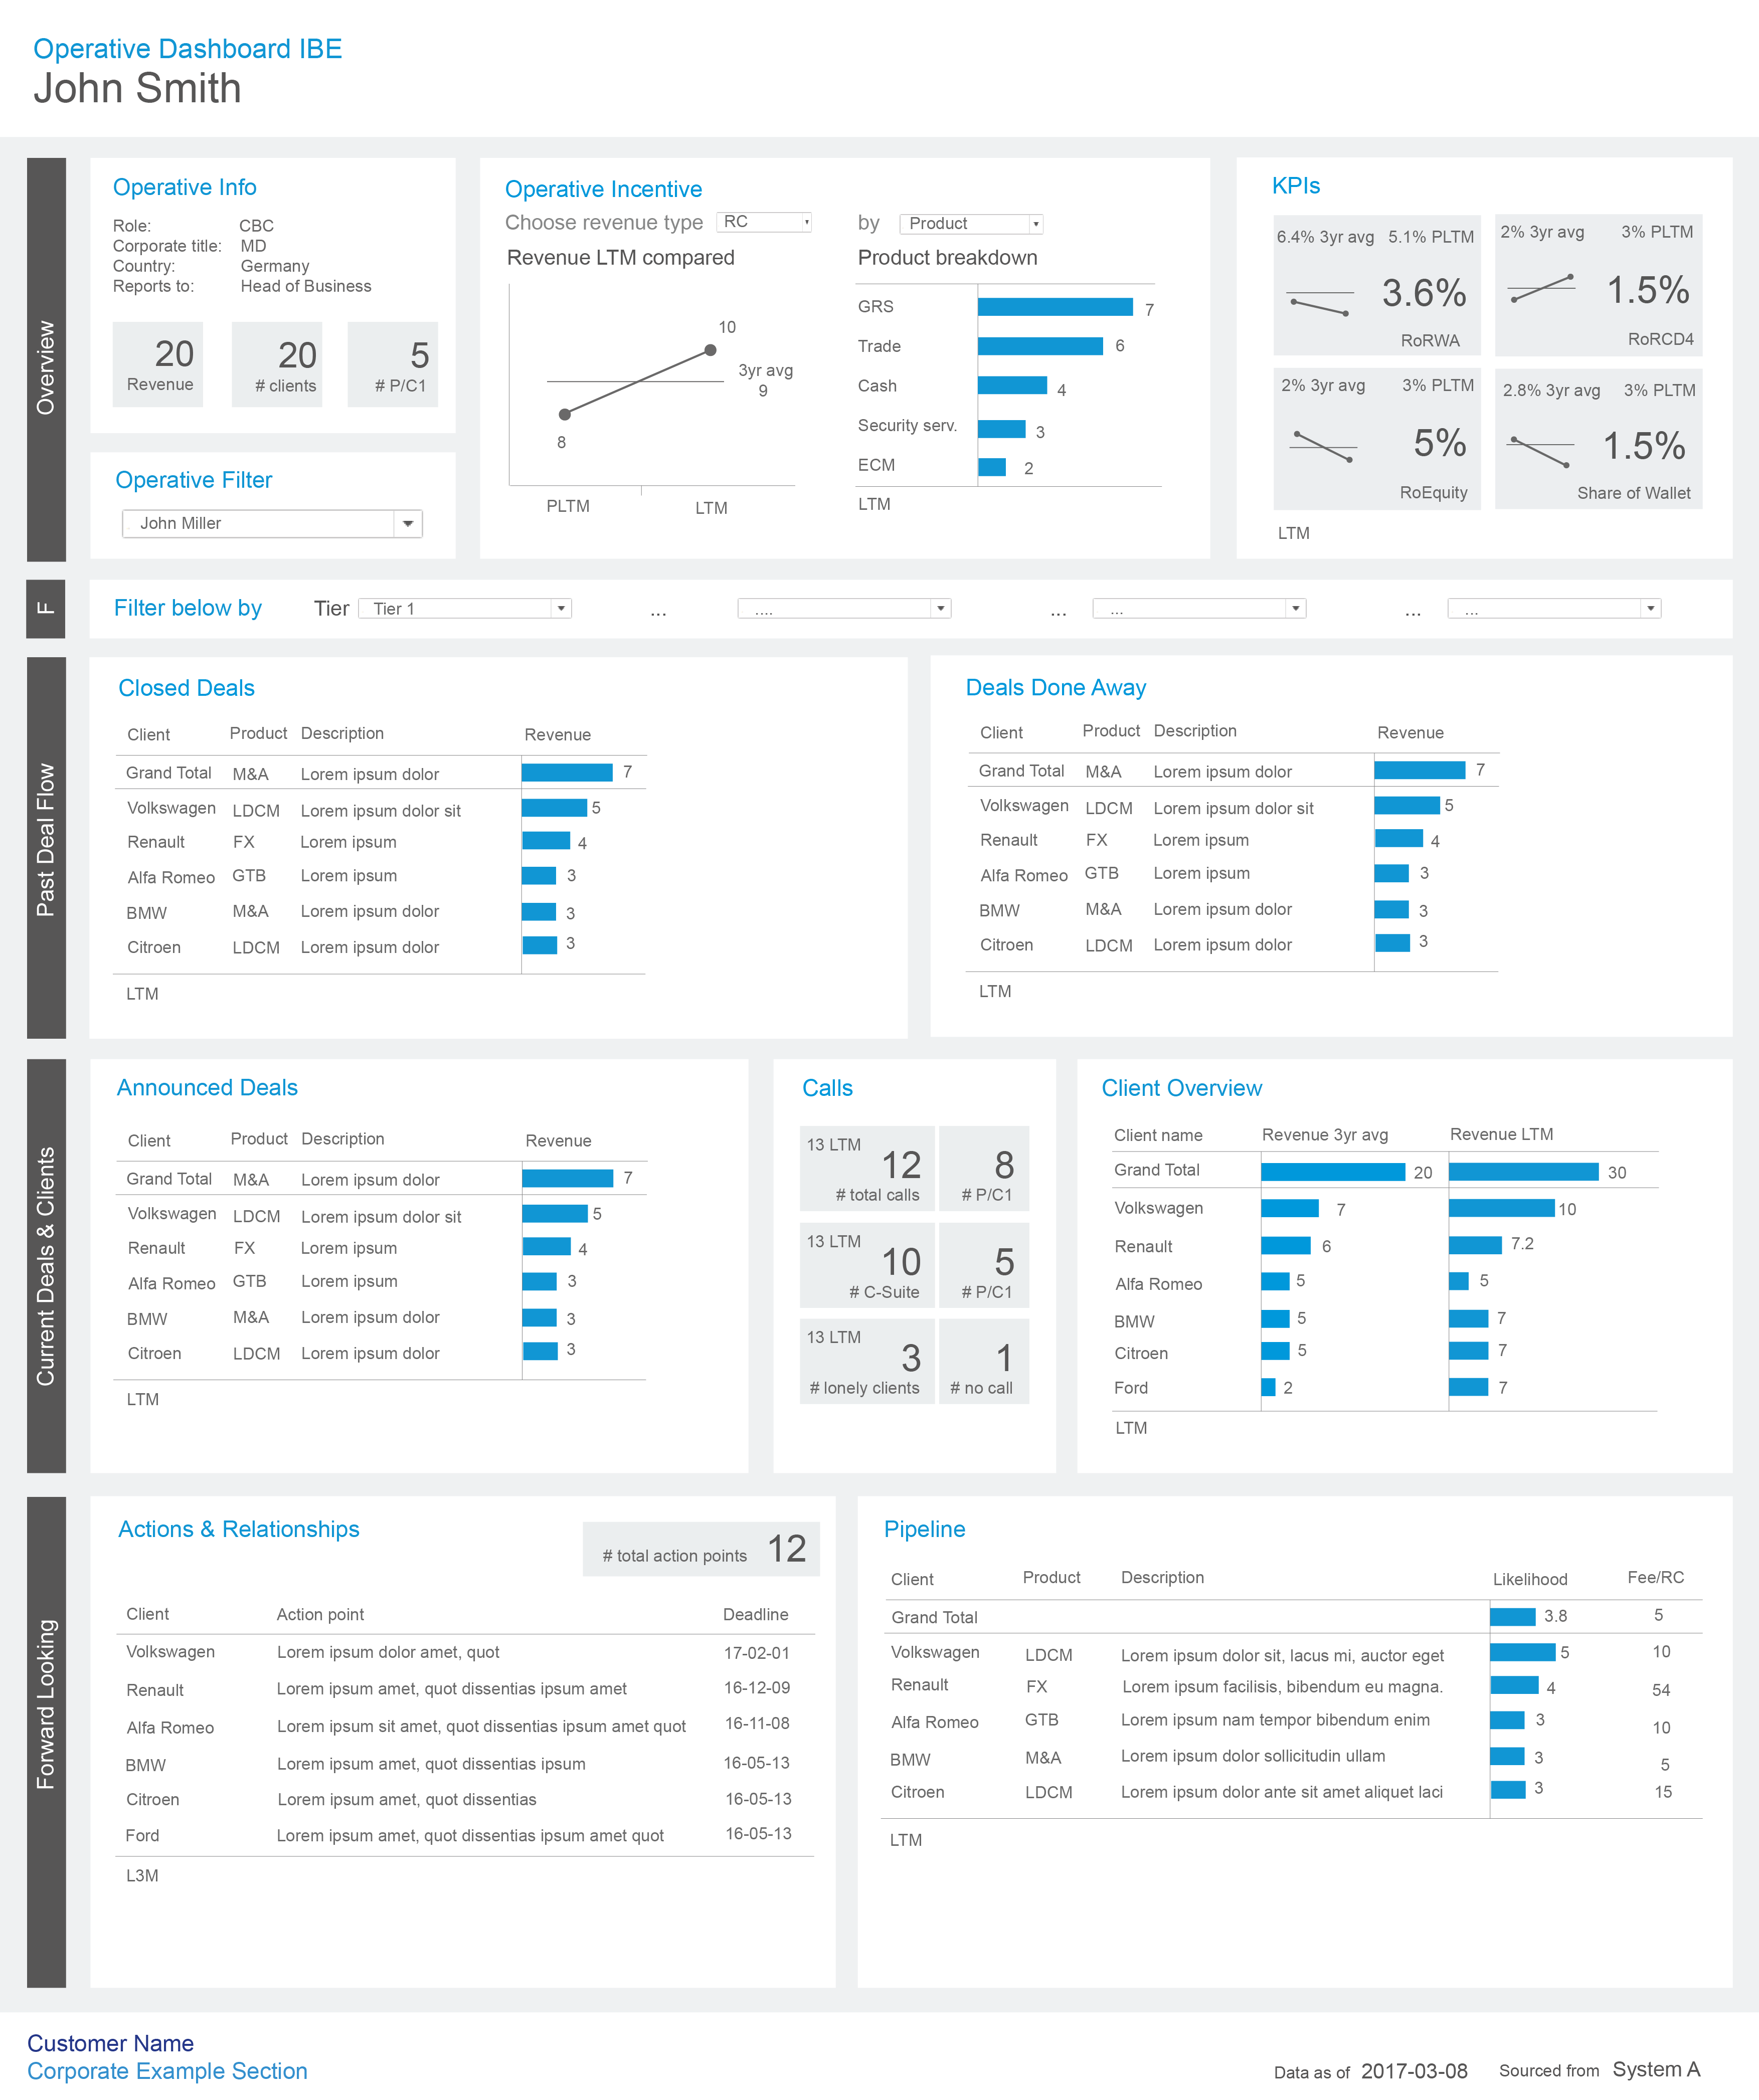
One of those clients was Deutsche Bank, where I had the honor of developing dashboard templates for. To meet Deutsche Bank’s exacting standards, I meticulously leveraged Tableau’s powerful capabilities to design visually stunning and highly optimized dashboard mockups. The aim was to equip the bank with a powerful tool that would enable them to delve deep into their client and employee data, uncovering actionable insights that could drive strategic decision-making.
The Deutsche Bank project was particularly exciting due to the comprehensive design guidelines provided. These guidelines laid the groundwork for developing an exceptionally clean and visually appealing dashboard template. What made this template truly special was its versatility and flexibility, making it an ideal foundation for numerous future mockups.
Having such a robust and user-friendly template at our disposal streamlined the dashboard development process and enabled us to deliver top-notch solutions promptly. The positive feedback received from Deutsche Bank underscored the template’s effectiveness in meeting their reporting needs while maintaining a consistently polished and professional look for many years to come.
Another client I had the privilege of working with is Roche, where I designed dashboard mockups that left a lasting impression. The team at Roche was delighted to witness their data transform into a sleek and visually engaging format, breathing new life into their insights.
Beyond the captivating aesthetics, the dashboards offer an intuitive flow of information, enabling seamless data exploration. The user experience is carefully crafted to ensure that stakeholders could effortlessly navigate through the data and derive meaningful conclusions.
Seeing the positive response from Roche was incredibly gratifying.
At Annalect, a member of the Omnicom Media Group EMEA, I had the fantastic opportunity to be part of the Alliance team for renowned brands like Nissan and Renault. My role revolved around crafting, supporting, and maintaining Tableau dashboards.
Working closely with the Head of Data & Reporting, the client team, and database engineers, we collaborated on exciting projects within the dynamic media environment. Together, we visualized and analyzed Adserver and Web Analytics data, offering valuable insights that drove business growth and success.
Handling vast amounts of data was the name of the game. I confidently delivered complex Tableau dashboards while also undertaking data processing and preparation projects with the help of Tableau Prep. This all involved expertly managing data, working seamlessly with SQL databases, and ensuring everything ran smoothly on Tableau Server.
At the heart of my work was a dedication to accuracy and data quality. I took great care to ensure that the reported data was not only precise but also presented in an easy-to-understand manner.