Drawing data just with lines

Drawing data just with lines

Made with Adobe Illustrator
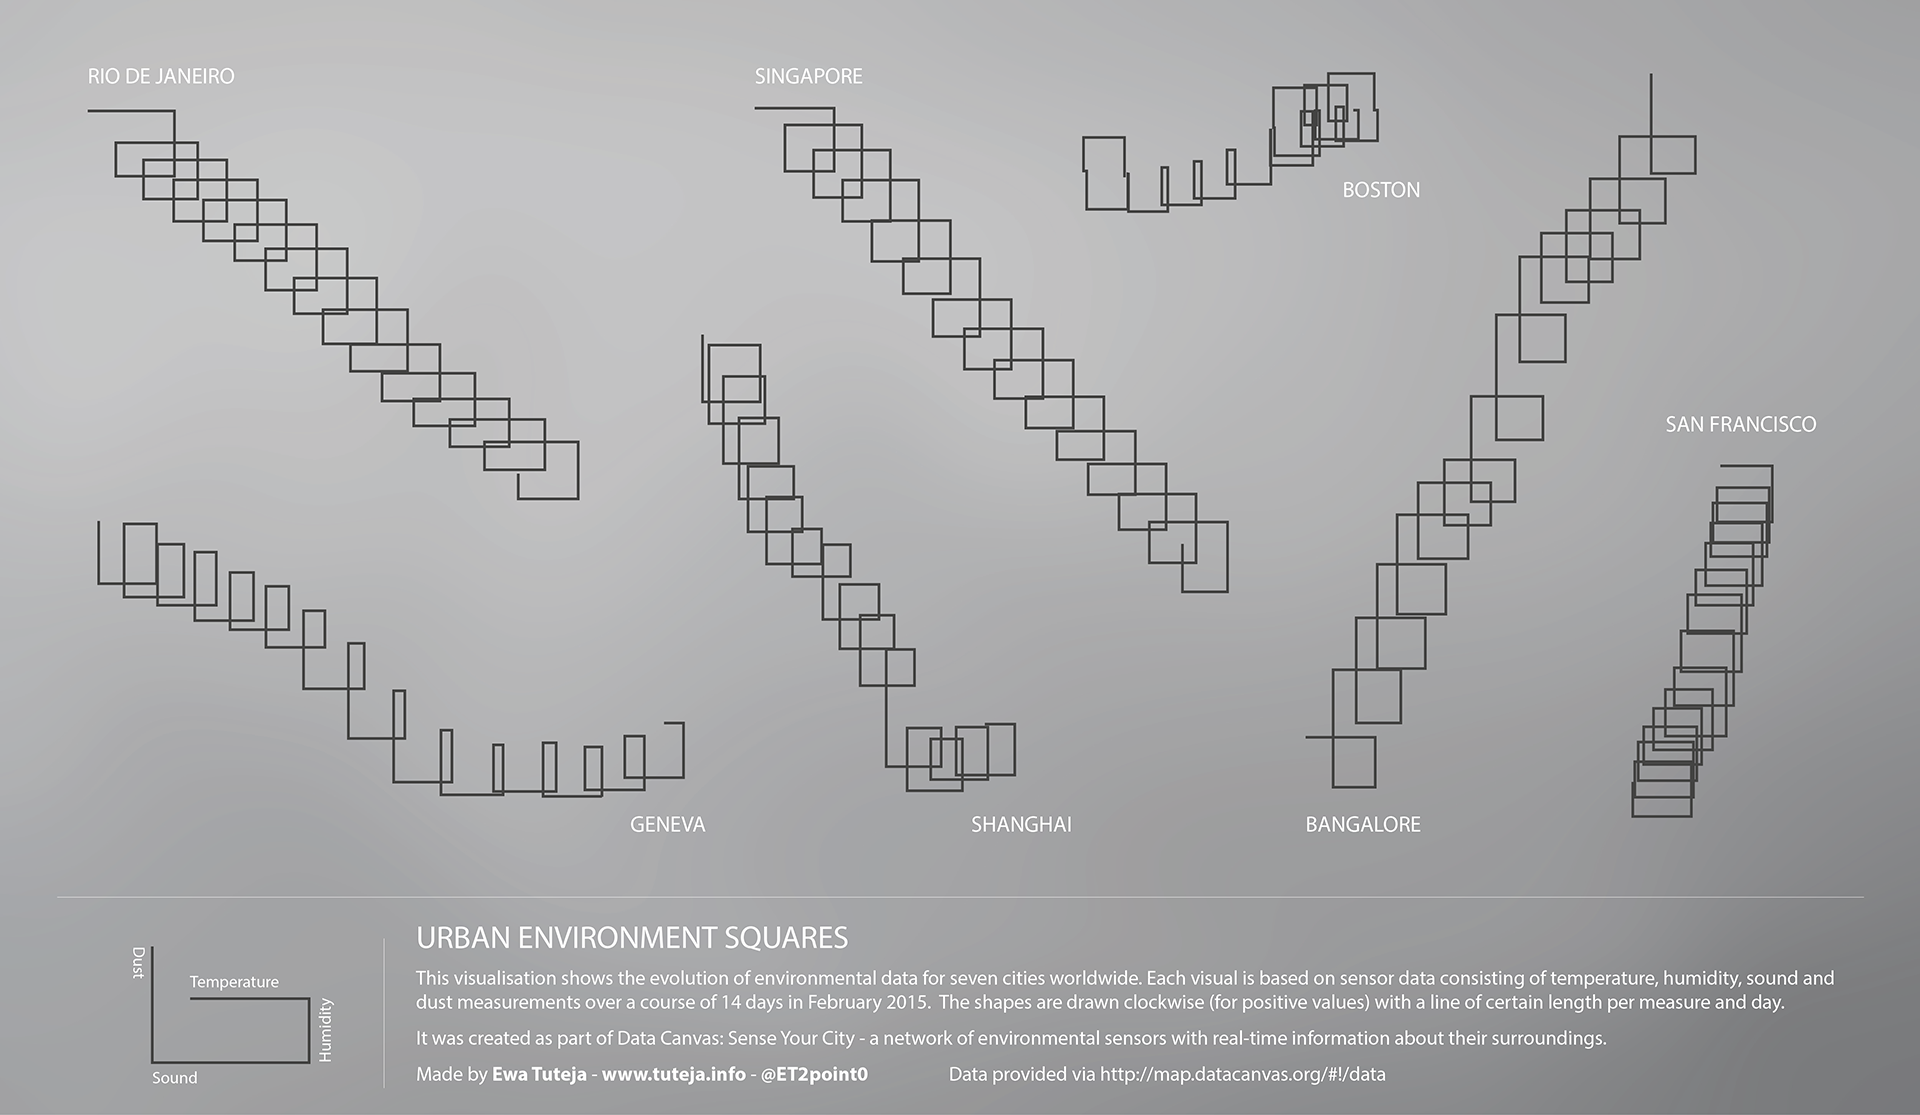
This visualization captures the evolution of environmental data across seven global cities. Through simplicity and innovation, this project translates sensor data into an abstract narrative.
Each square is a dance of lines, a visual flow born from the sensor data provided by Data Canvas: Sense Your City. Temperature, humidity, sound, and dust measurements taken over a 14-day period converge to shape these squares. As lines unfurl clockwise for positive values, each day’s measurement contributes to the length of the line.
The magic lies in its simplicity; a simple representation that resonates with the complexities of urban ecosystems. “Urban Environment Squares” beckons you to experience data in an artistic light, reminding us of the boundless creativity in translating numbers into captivating visual tales.
At that time I was deeply inspired (and am to date) by Stefanie Posavec‘s visionary work, particularly her project “Writing Without Words”. Her ability to transform intricate concepts into visual poetry encouraged me to embark on a similar journey, culminating in a quick go at it with “Urban Environment Squares”. Just as Posavec’s work speaks to the power of artistic interpretation, I aspire for this project to do the same.