A Tableau Viz for Makeover Monday
A Tableau Viz for Makeover Monday
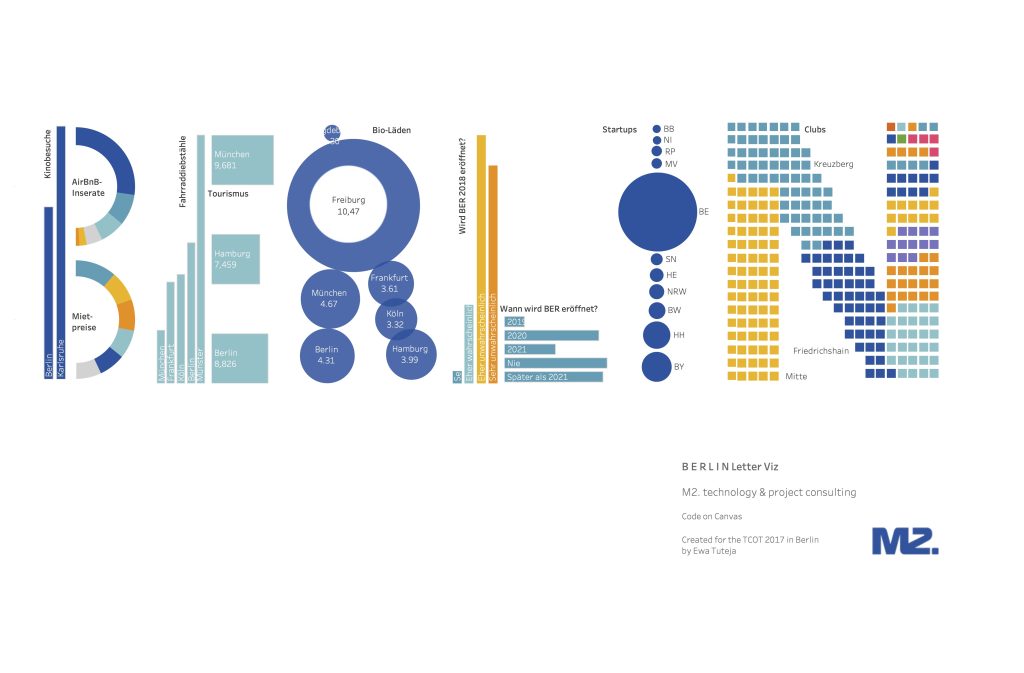
Created for Makeover Monday, with Tableau
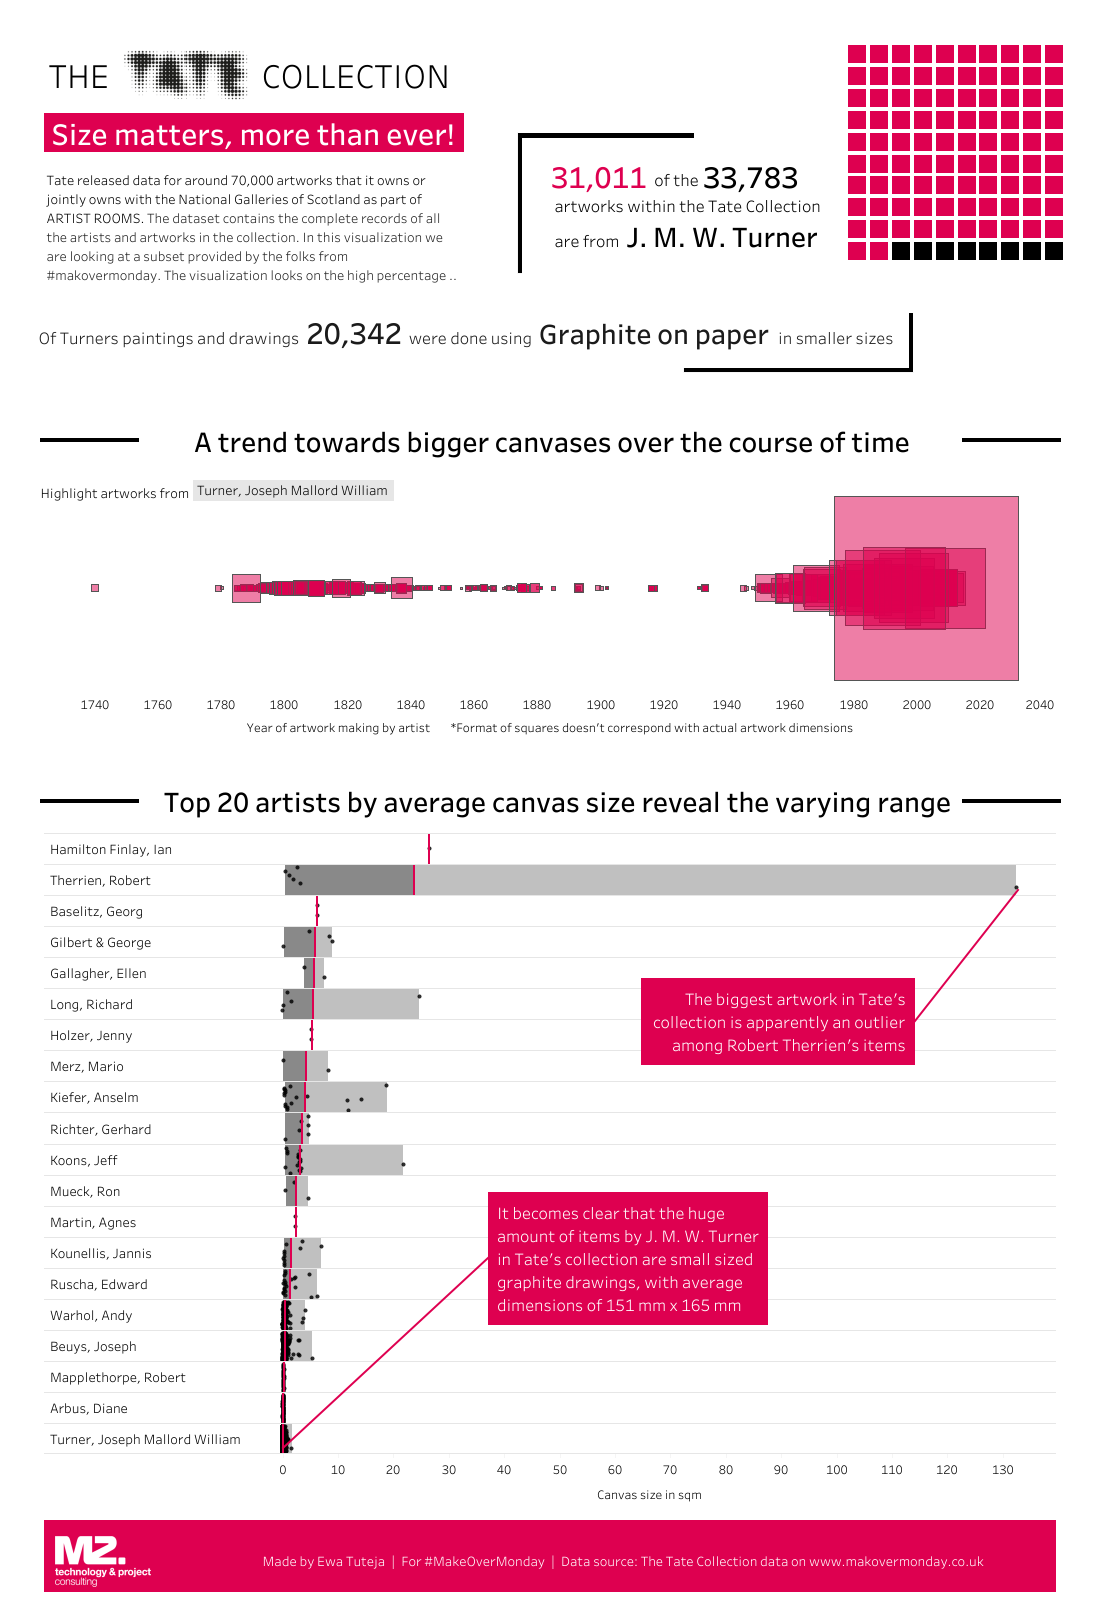
I am sure you are familiar with the weekly community project Makeover Monday. If you are not I highly recommend checking it out. This visualization was created for one of the challenges. In this particular week, we delved into the captivating world of Tate’s remarkable collection of artworks, armed with a dataset comprising around 70,000 masterpieces owned by Tate or jointly with the National Galleries of Scotland under the prestigious ARTIST ROOMS.
For this challenge, I set my sights on exploring the exceptional works of the renowned artist J. M. W. Turner. I transformed the dataset into a Tableau visualization that captivated not only the eyes but also the hearts of the community.
My visualization highlighted the staggering percentage of artworks attributed to J. M. W. Turner within the Tate’s collection. Additionally, I honed in on a particularly intriguing aspect – the sizes of the canvases adorning the hallowed walls of Tate.
To my delight, my work garnered recognition as I claimed the post thumbnail and first favourites mention. ^^ Here are the aspects Eva Murray liked about my viz:
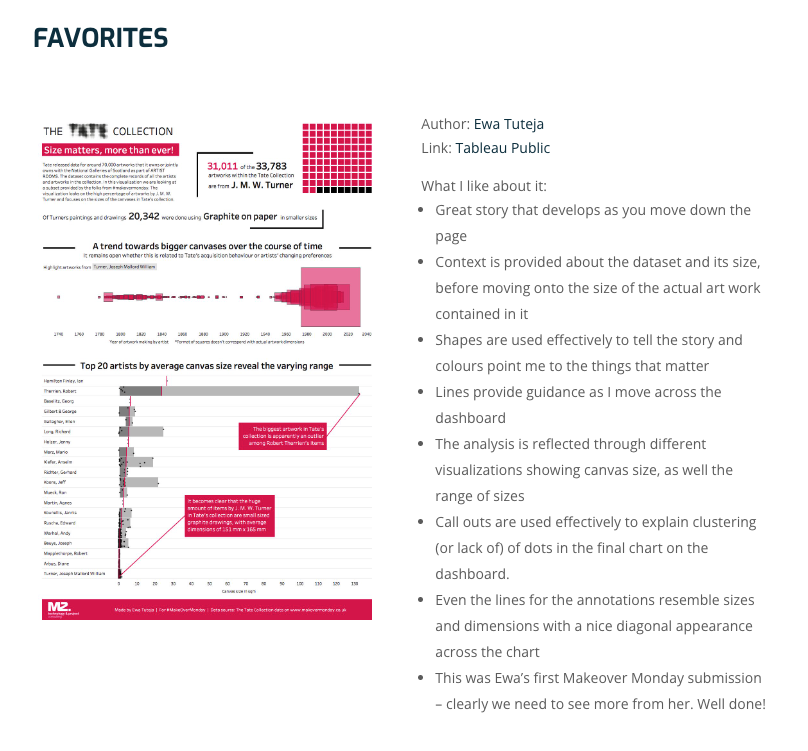
These small and big achievements fuel my passion for data storytelling and capturing the essence of captivating datasets through the lens of visualization. As I venture further into the realm of data exploration, I am ever eager to uncover new narratives, create immersive experiences, and continue my quest to make a meaningful impact in the world of data visualization.