Made With D3.js

Made With D3.js

Made for the visualizing.org challenge “The Impact of the World Wide Web”, with d3.js
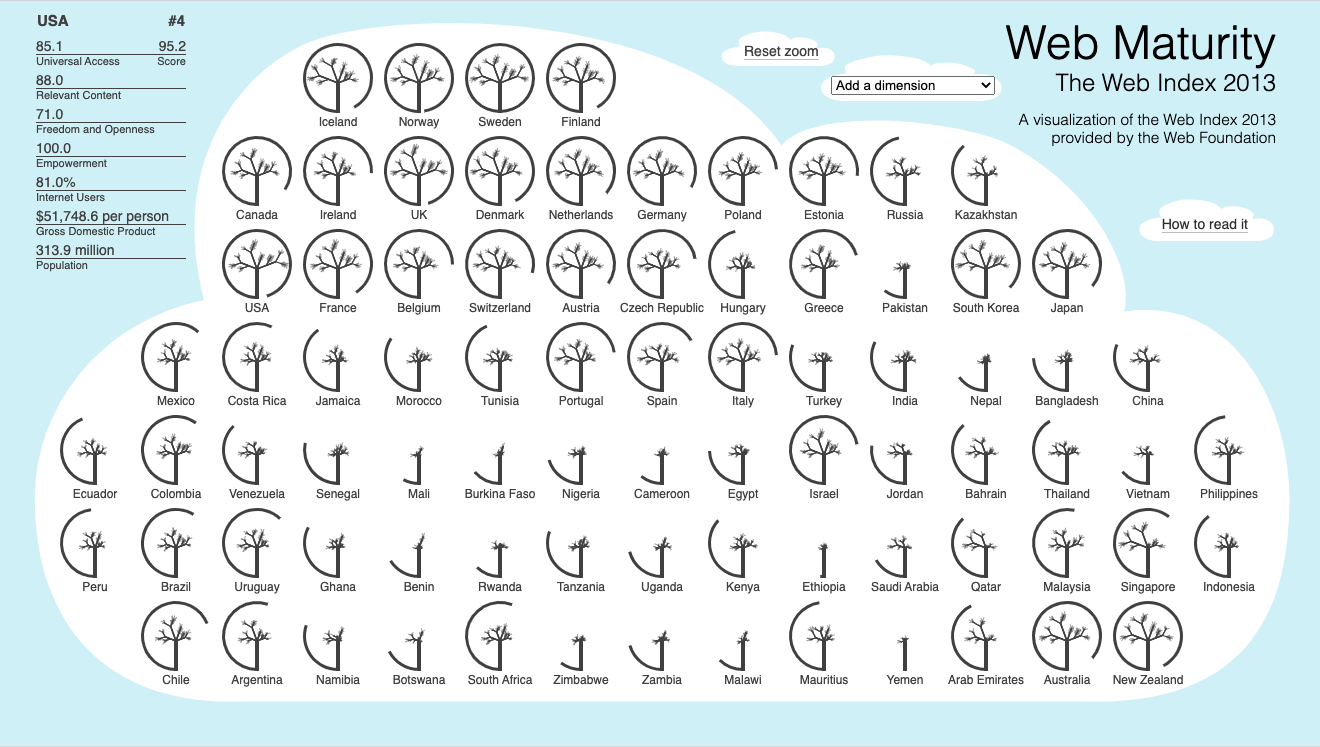
This project marked my debut as a data visualization specialist in a spectacular fashion. Powered by d3.js, this data visualization emerged as the winning entry in the visualizing.org challenge “The Impact of the World Wide Web.” The win was not just a victory; it was the announcement of my foray into the world of data visualization.
At its core, this data visualization delves into the intricacies of the World Wide Web’s maturity and its implications across 81 selected countries. It visualizes the World Wide Web Foundation’s Web Index for the year 2013 – a comprehensive assessment of the web’s performance in each country, categorized by indicators spanning affordable internet access, web freedom, content availability, and its impact on society, economy, and politics.
This project holds a special place in my heart, not only for its intricate visualization of the web’s impact but also for the pivotal role it played in launching my data visualization career. As a novice, armed with a newfound understanding of d3.js, HTML, and CSS, I was super excited to take part in my first data visualization challenge.
Securing the winning title in the “The Impact of the World Wide Web” challenge on visualizing.org was a memorable moment. This triumph instilled the confidence and conviction needed to steer my career towards becoming the data visualization expert I am today, eight years later. The validation this achievement provided wasn’t just about winning a challenge; it was about recognizing the untapped potential I had within me.
As I look back, I am grateful for the fortuitous intersection of curiosity, coding, and creativity that birthed this project. It was the catalyst that set me on a trajectory of continuous growth, learning, and innovation.