Book Publication & Kantar IIB Awards Longlist
Book Publication & Kantar IIB Awards Longlist
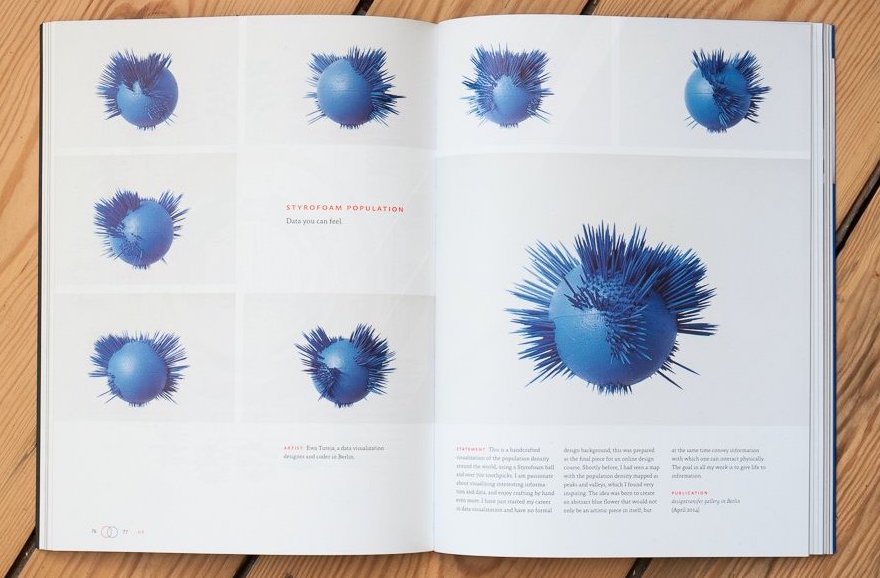
Made with a styrofoam ball and over 700 toothpics
I took on a thrilling and enlightening challenge, drawing our very own world map onto a styrofoam ball by hand. The task was both captivating and exhausting and it left me with a profound understanding of continent proportions on a 3D sphere.
The result of this labor of love is a piece that brings population density around the world to life. With one styrofoam ball and over 700 meticulously placed toothpicks, I crafted a representation of global population patterns. Each toothpick serves as a data point, communicating the complexities of population distribution in a tangible way.
This work found its place in a exhibition at designtransfer gallery in Berlin. And that’s not all – my heart swells with pride as this creation earned a spot in the celebrated book, The Best American Infographics 2015. 🥳
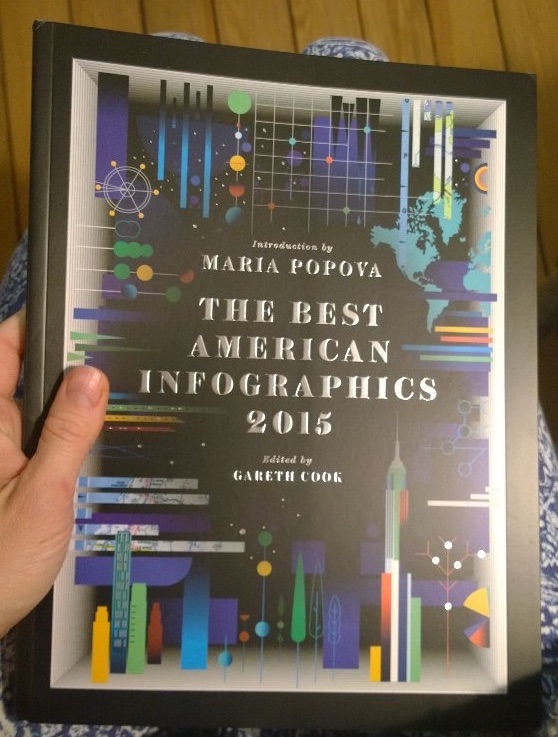
It also got longlisted at the esteemed Kantar Information is Beautiful Awards in November 2014, which is another beautiful testament, that makes me proud.
If you’re curious about the creative process behind this unique piece, I invite you to witness its evolution through a timelapse video. There’s nothing quite like physically crafting data into form – a journey that left me enriched, enlightened, and eager to inspire others to delve into the realm of physical data visualization. I encourage everyone to embark on a similar creative endeavor.