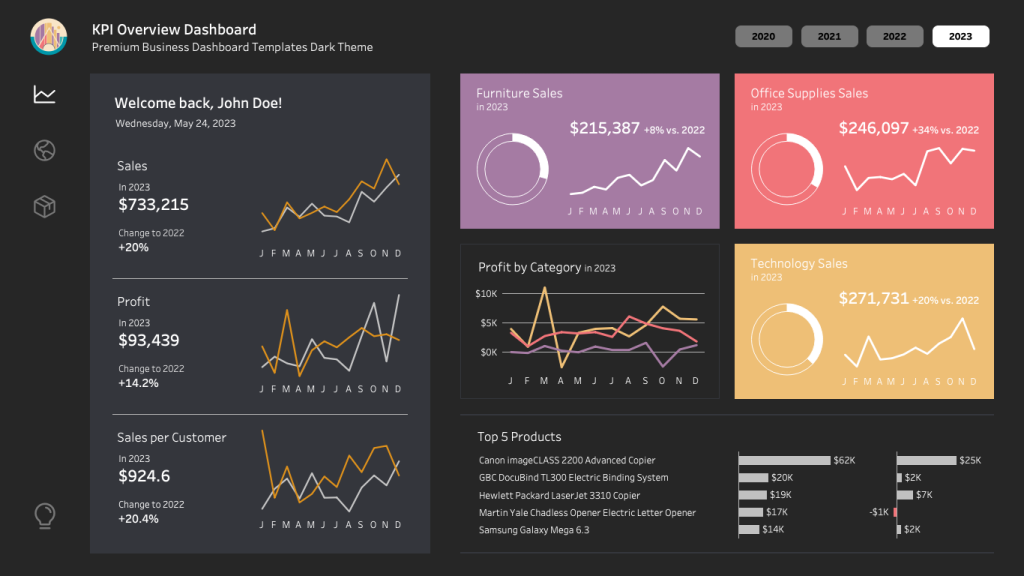
Dashboard Design and Development
Wall Hanging Tapestry
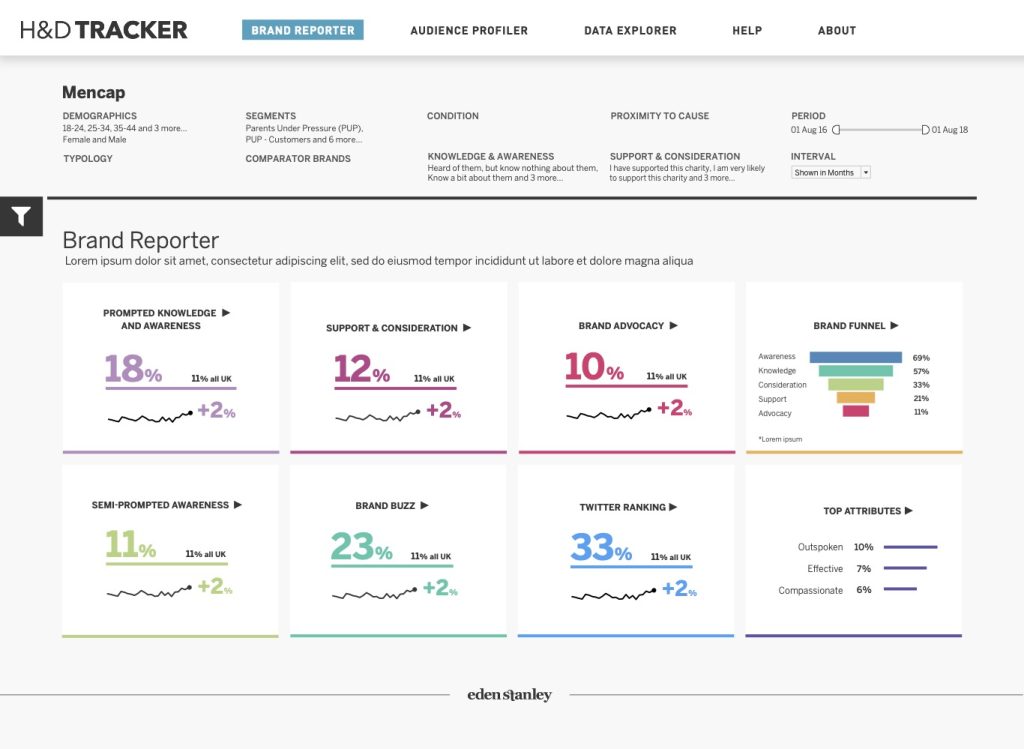
Tableau Survey Data Product
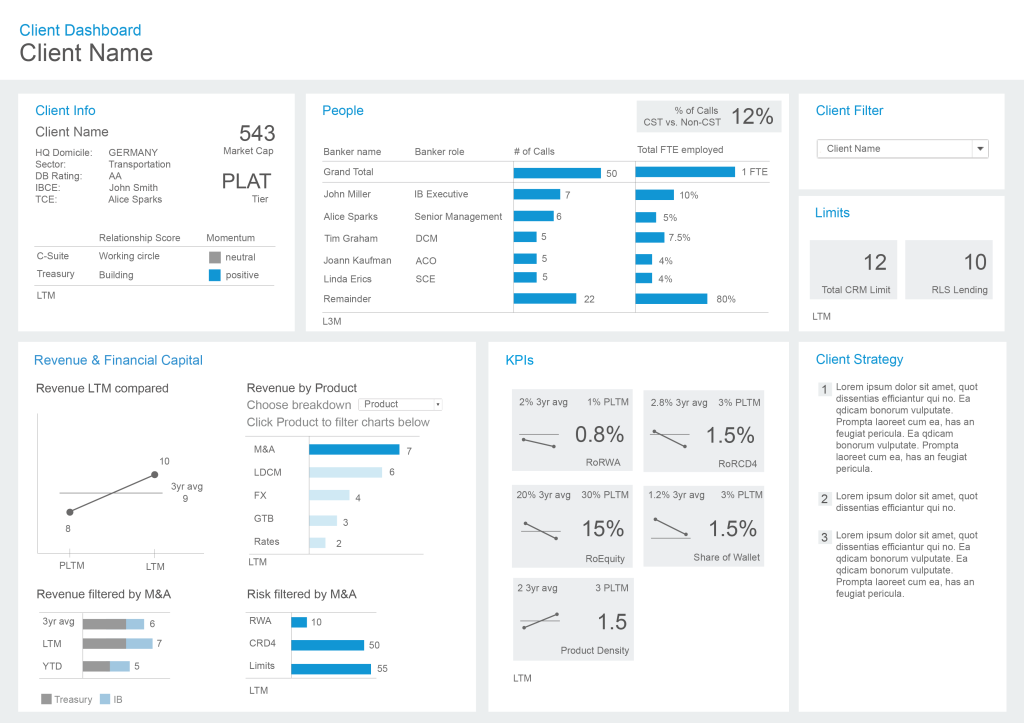
Tableau Dashboard Mockups
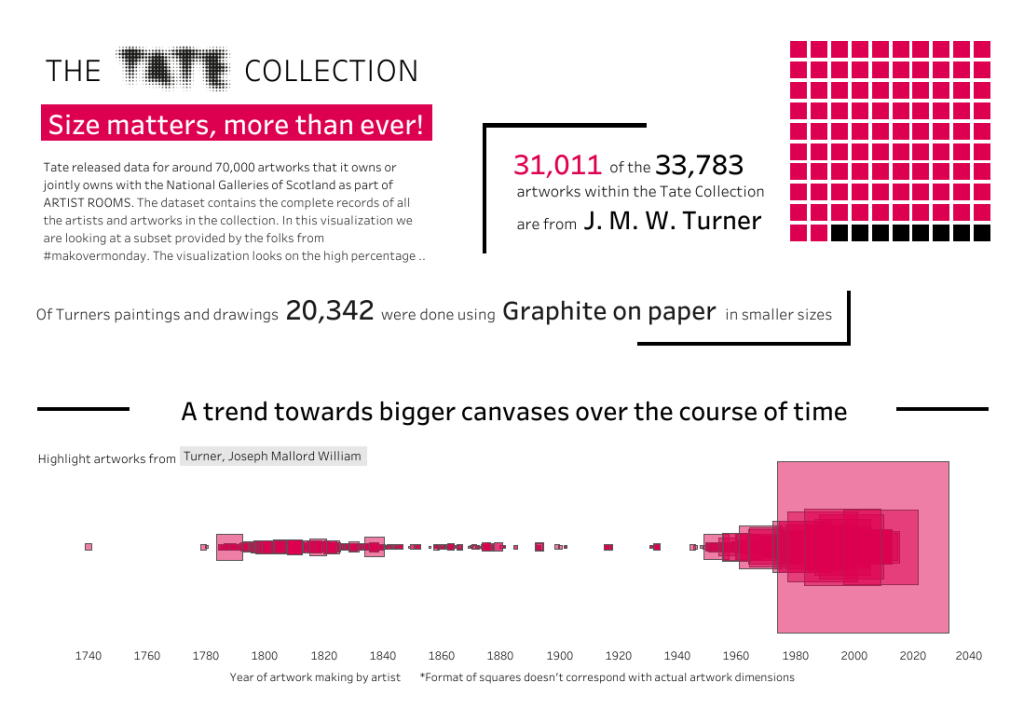
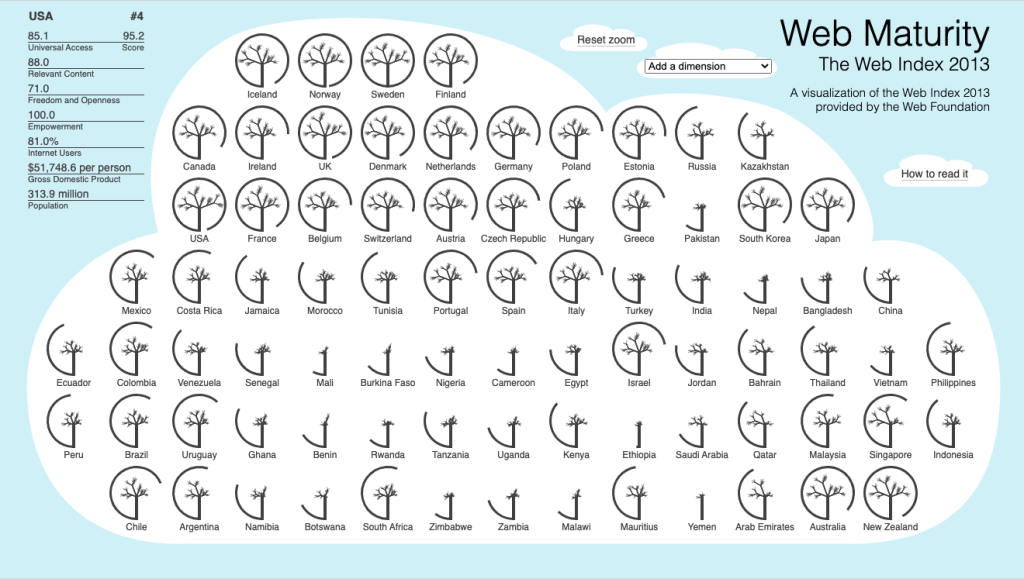
Writing With Charts
A Tableau Viz for Makeover Monday
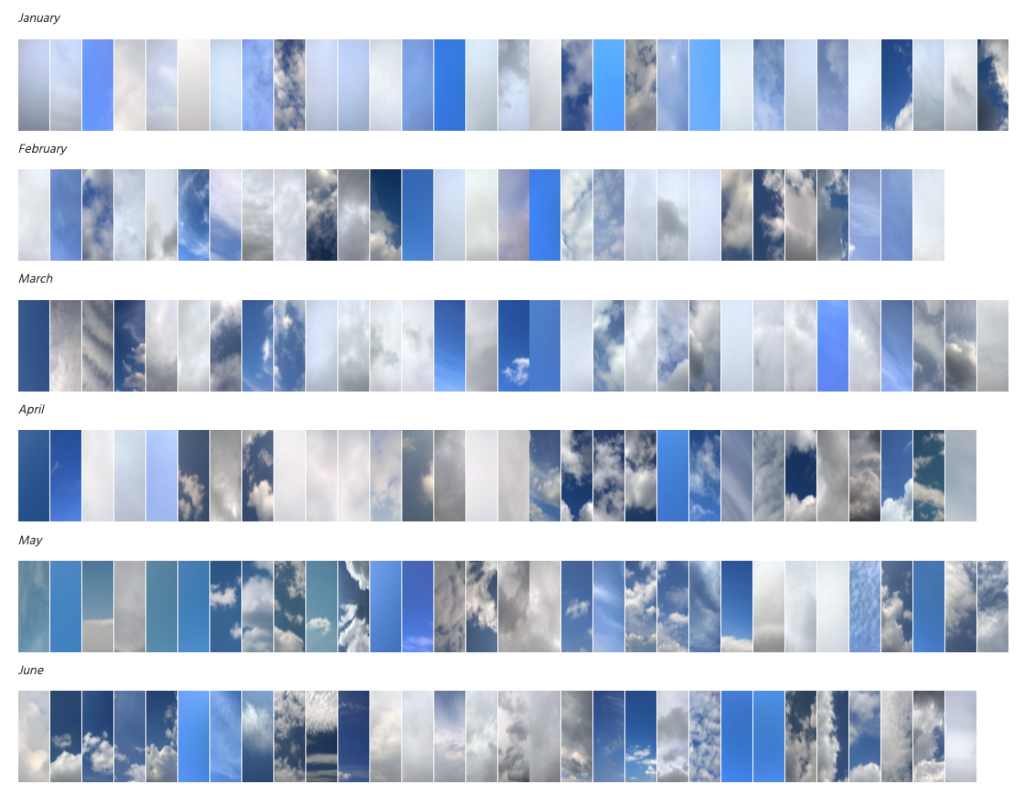
A Photography Project
Reviving The Ancient Incan Quipu
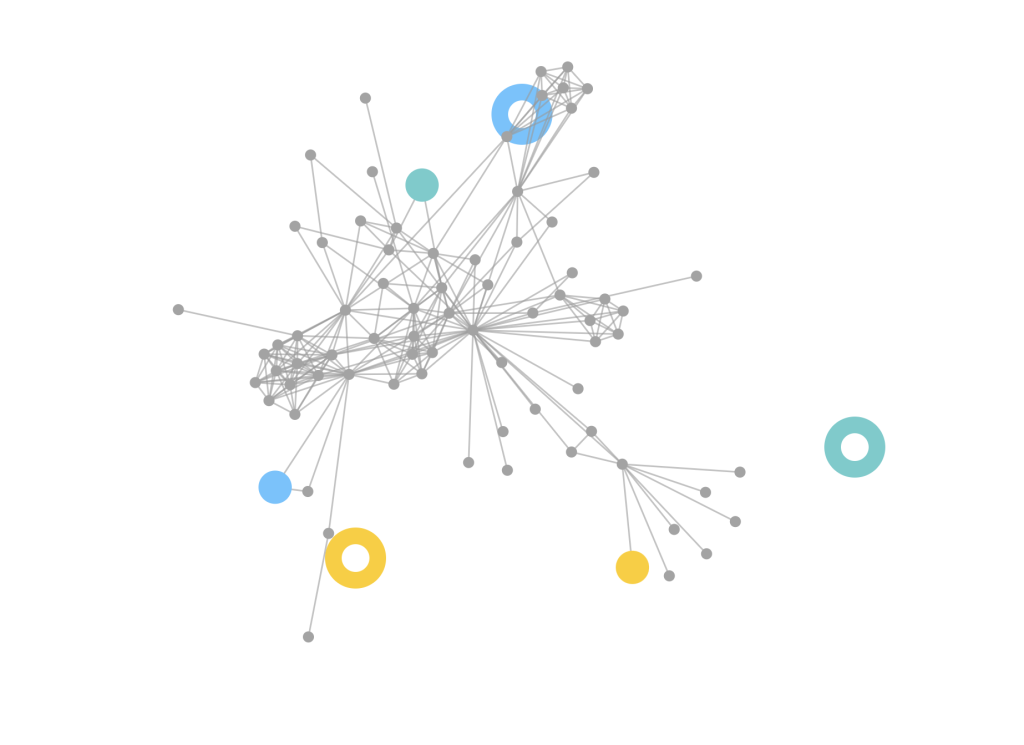
Navigation Reinvented With D3.js
Made With D3.js
Book Publication & Kantar IIB Awards Longlist
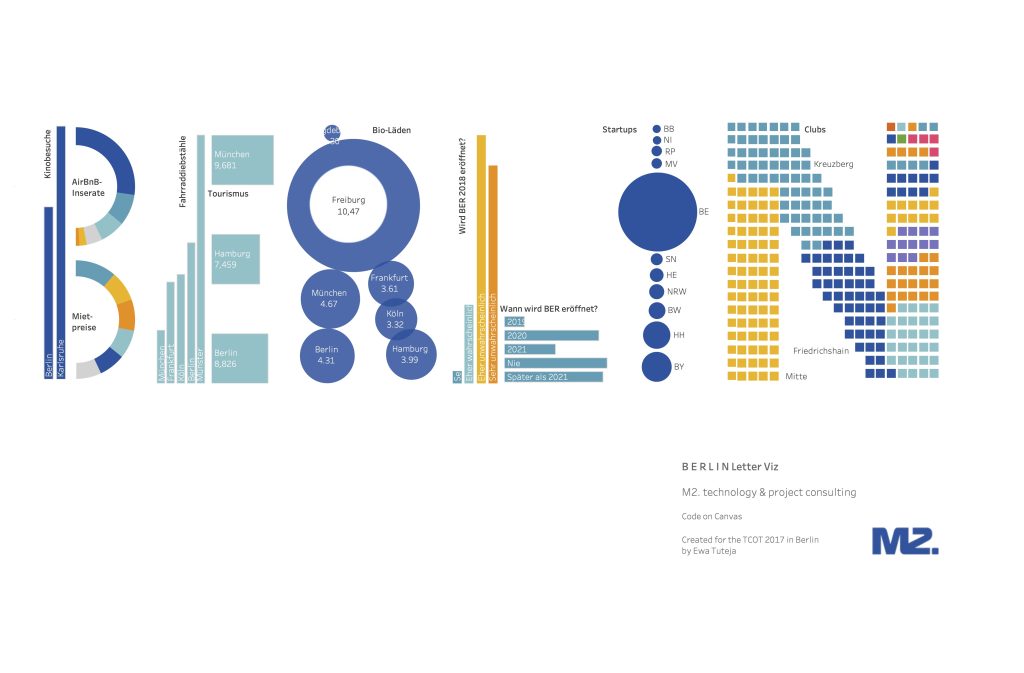
Drawing data just with lines